Weather and Climate
Once you have completed your bar graph, use it to respond to the following questions on page 11 in your Engineering Portfolio:
Question 1: For the severe weather event that you chose, what was the total number that happened from 2002-2012?
Question 2: For the severe weather event that you chose, which year had the highest number?
Question 3: Do you see any patterns or trends in your weather data?
Looking at weather data over a long period of time helps us figure out what our climate climate is like. Climate is similar to weatherweather, but it is not what the weather is like on any given day—it is what the weather is usually like over long periods of time. So even though some days have weather that is rainy, sunny, foggy or snowy, the overall climate in Maryland is one of hot, humid summers and mild winters.
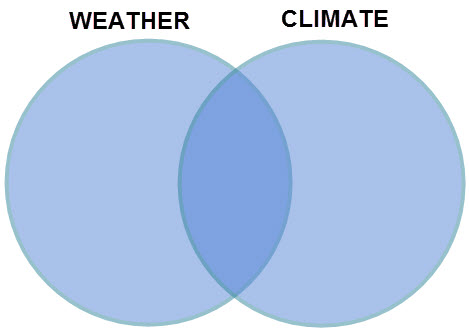
Now your teacher will lead an activity in which you will complete a Venn Diagram with your whole class to compare and contrast climate and weather.

Scientists look at weather data over a period of many years to see how our climate is changing. You looked at data over a period of ten years—but believe it or not, that is not considered a long time when we talk about climate. Scientists have looked at climate data going back hundreds and thousands of years. They say that the climate on our planet is getting warmer. This is called "global climate change." It is causing an increase in severe weather all over the planet.
