Are Our Homes Built for Severe Weather?

Skip Main Navigation
  • Home
  • Lesson Activities
    • Introduction
    • Severe Weather
    • Weather Brainstorm
    • Impacts of Severe Weather
    • Explore Severe Weather
    • Maryland Weather
    • Graphing Maryland Weather
    • Weather and Climate
    • Protecting Homes From Severe Weather
    • Protect a Home
    • Weatherproof Your Home
    • Final Project
  • Student Resources
    • Table of Contents
    • Glossary
    • Engineering Portfolio
    • Did You Know
  • Teacher Resources
    • Lesson Preparation
    • Lesson Overview
    • Objectives
    • Using This Site
    • Technology
    • Schedule
    • Essential Questions
    • Enduring Understandings
    • Background Information
    • Assessment
    • Teacher Notes
    • Appendices
  • STEM Careers
  • Introduction
  • Severe Weather
  • Impacts of Severe Weather
  • Explore Severe Weather
  • Maryland Weather
  • Graphing Maryland Weather
  • Weather and Climate
  • Protecting Homes from Severe Weather
  • Protect a Home
  • Weatherproof Your Home
  • Final Project
  • Glossary

Graphing Maryland Weather

tornado
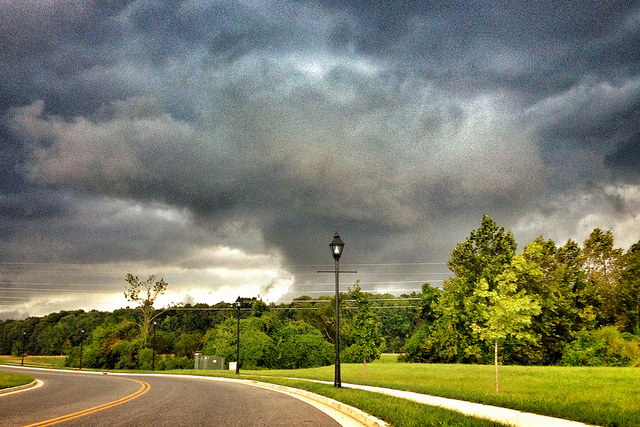
This tornado whipped through Maryland's Eastern Shore on September 8, 2012.
Image courtesy of Matthew Straubmuller/flickr/Creative Commons 2.0

Now use the data in the table to create a bar graph bar graph of severe weather in Maryland from 2002-2012. Choose one severe weather event and create a graph showing how often it occurred every year from 2002-2012.

Create your bar graph using the grid paper on page 10 in your Engineering Portfolio.

Be sure to include a title, labels and a scale on your bar graph.

Teacher Note

Before the activity begins, have students turn to pages 10 of their Engineering Portfolios. Students will use the weather data from their charts to create a bar graph in their Engineering Portfolios.

Read More

Essential Questions

  • What can weather data tell us about the frequency of severe weather events?
  • How can technology be used to collect data about weather conditions?

Did You Know?

Watch this slideshow that explains how technology can be used to collect data about the weather.

Go to Slideshow

<< Go to First page < Go to Previous page
  • Go to page1
  • Go to page2
  • Go to page3
  • Go to page4
  • Go to page5
  • Go to page6
  • Go to page7
  • Go to page8
  • Go to page9
  • Go to page10
  • Go to page11
  • Go to page12
Go to Next page > Go to Last page >>
Site Map | Accessibility | About

This website is a production of Maryland Public Television/Thinkport in collaboration with the Maryland State Department of Education. The contents of this website were developed under a grant from the U.S. Department of Education. However, those contents do not necessarily represent the policy of the U.S. Department of Education, and you should not assume endorsement by the Federal Government.

Thinkport Maryland State Department of Education Maryland - STEM education

2013 Copyright Maryland State Department of Education

Creative Commons logo

Contact the MSDE Office of Instructional Technology for copyright questions.